
Filed under Areas · 4 min read
Richmond is built along the James River, and two things shape daily life and home buying here: long, hot summers and a river with a long record of floods. Neither is a reason to avoid the city. Both are worth understanding before you choose a home.
The climate in numbers
NOAA’s 1991 to 2020 climate normals for Richmond International Airport give this picture:
| Month | Average high | Average low | Precipitation | Snowfall |
|---|---|---|---|---|
| January | 47.8 F | 28.8 F | 3.23 in | 3.7 in |
| February | 51.6 F | 30.4 F | 2.61 in | 2.2 in |
| March | 59.6 F | 37.2 F | 4.00 in | 1.1 in |
| April | 70.4 F | 46.4 F | 3.18 in | 0 |
| May | 77.8 F | 55.7 F | 4.00 in | 0 |
| June | 85.6 F | 64.5 F | 4.64 in | 0 |
| July | 89.5 F | 69.2 F | 4.37 in | 0 |
| August | 87.5 F | 67.6 F | 4.90 in | 0 |
| September | 81.2 F | 61.1 F | 4.61 in | 0 |
| October | 70.9 F | 49.0 F | 3.39 in | 0 |
| November | 60.4 F | 38.8 F | 3.06 in | 0 |
| December | 51.5 F | 32.1 F | 3.51 in | 1.8 in |
Over a normal year Richmond gets 45.50 inches of precipitation and 8.8 inches of snow. It averages 44.9 days with a high of 90 F or more and 73.5 days with a low at or below freezing. The wettest stretch is summer, June through September, when thunderstorms add up. Snow does fall, mostly in January and February, but in modest amounts.
What that means for a household
- Air conditioning is a necessity, not a luxury, for July and August.
- Winter lows average just below freezing in January, so heating still matters, though average highs stay in the upper 40s even in the coldest month.
- Keep a snow shovel and an ice scraper. The yearly normal is under 9 inches, but it arrives in a few events.
Flood risk from the James River
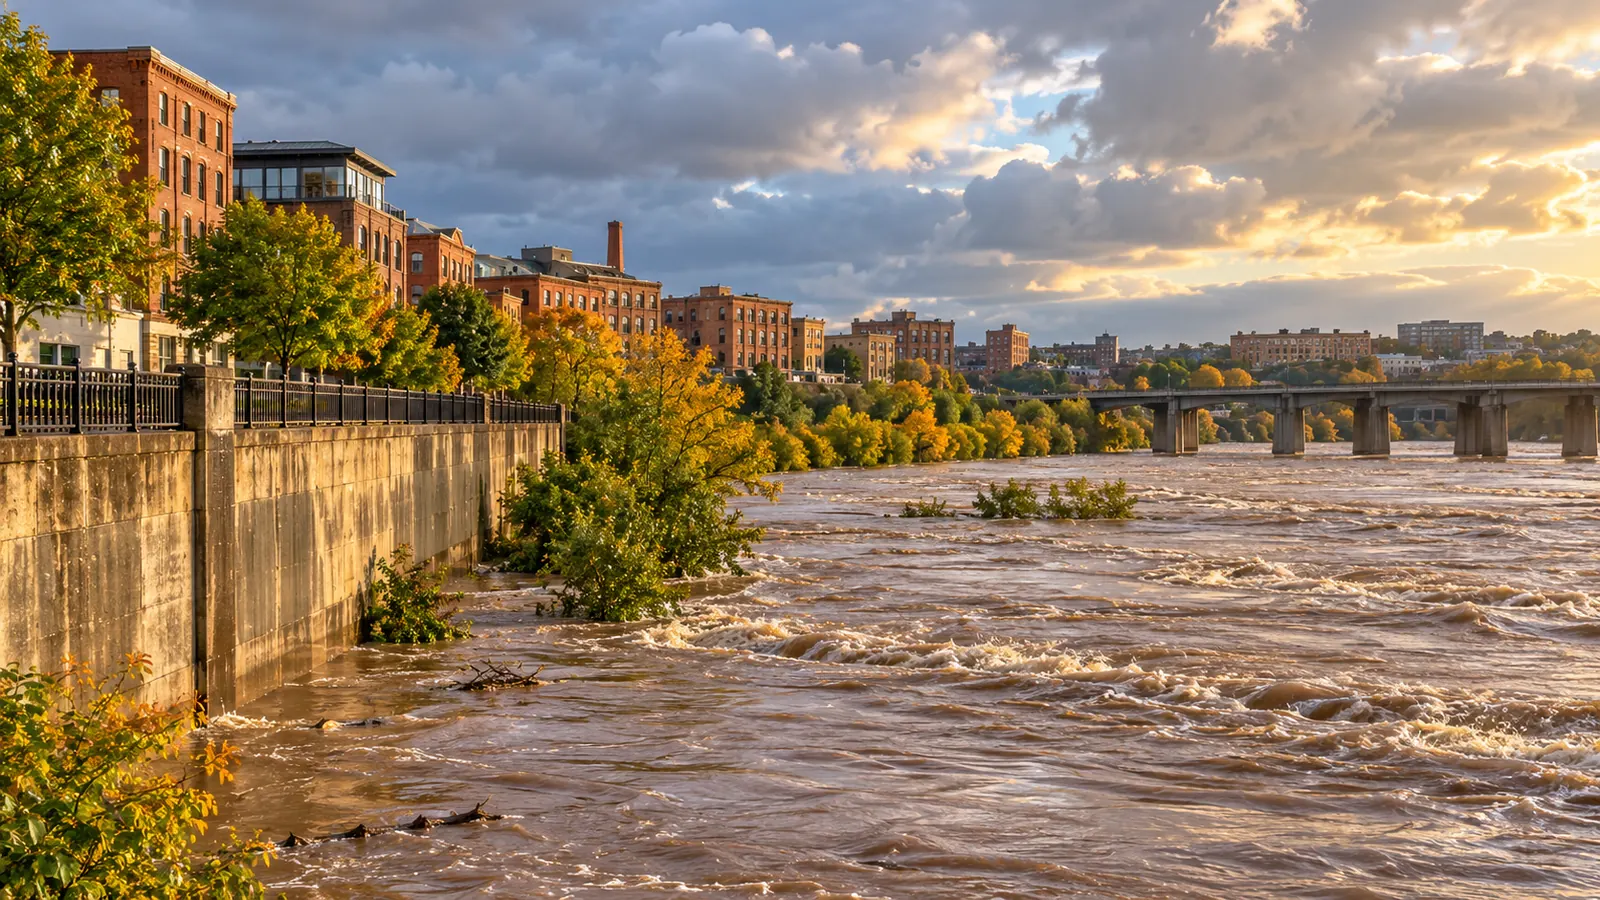
The bigger planning question is water. The National Weather Service tracks the James River at the Richmond-Westham gauge and sets these flood categories:
| Category | River stage | Flow |
|---|---|---|
| Action stage | 9 ft | 22,600 cfs |
| Minor flooding | 12 ft | 42,000 cfs |
| Moderate flooding | 15 ft | 66,700 cfs |
| Major flooding | 22 ft | 167,000 cfs |
The river has gone far past major stage before. The highest crests on record at Westham are 28.62 feet on June 23, 1972, at a flow of 313,000 cubic feet per second; 24.95 feet on August 21, 1969; 24.77 feet on November 7, 1985; 23.42 feet on March 19, 1936; and 22.65 feet on April 27, 1937. The river’s level reflects rain across its whole watershed, so watch the river forecast, not just the local sky.
Downstream, a second National Weather Service gauge on the James at the Richmond Locks uses its own scale: action at 6 feet, minor flooding at 8, moderate at 19 and major at 28. Its record crest was 36.5 feet in June 1972, measured on an older datum. When you read a river forecast, check which gauge it refers to.
Smaller-scale flooding
River floods are not the only kind. Heavy downpours can overwhelm streets and creeks. About one-third of the city, roughly 12,000 acres, is served by a combined sewer system that carries stormwater and sewage in the same pipes. The city’s Department of Public Utilities runs a separate stormwater utility, billed monthly to property owners.
How to check a property
- Ask the seller or landlord directly whether the property has ever flooded or had water in the basement.
- Look at where the property sits relative to the river and any creeks. Low-lying land near water deserves a closer look.
- Check the city’s Parcel Mapper and zoning information for the address.
- Ask an insurance agent for a flood insurance quote before you buy; the price itself is a signal of how the property’s risk is rated.
- Sign up for weather alerts and learn where your nearest high ground is.
Driving when water is on the road
The National Weather Service says more deaths occur from flooding each year than from any other thunderstorm-related hazard, and the Centers for Disease Control and Prevention report that over half of flood-related drownings happen when a vehicle is driven into hazardous floodwater. The rule is in the name of the NWS campaign: Turn Around, Don’t Drown. Never drive through water when you cannot see the road beneath it.
Tip: If you move in summer, plan outdoor moving days for the morning, keep water in the car and check the forecast for afternoon thunderstorms, which are common from June through September.
For the costs of cooling a home, see Setting Up Utilities in Richmond: City Water, Sewer, Gas and Stormwater Explained. For choosing a neighborhood with these factors in mind, start with Choosing a Richmond Neighborhood: The City’s Own Maps and Rules Every Newcomer Should Check.